Phase Detection Autofocus (PDAF) is one of the key advantages of D-SLR cameras over conventional Point-and-Shoot cameras, which usually employ contrast based autofocus system by sweeping through the focal range and stopping at the point where maximum contrast is detected. A good tutorial about how PDAF works can be found @ http://photographylife.com/how-phase-detection-autofocus-works.
In the following, I show how to find the phase difference in Python when two separate distributions are obtained from two separate AF sensors corresponding to one particular AF point. The function ‘correlate’ actually does a brute-force search in the entire phase shift space and returns a phase shift value which corresponds to the maximum correlation value.
import numpy as np
from scipy import signal

def gaussian(x, mu, sig):
    return np.exp(-np.power(x - mu, 2.) / 2 * np.power(sig, 2.))

n_ele = 100
dt = np.linspace(0, 10, n_ele)
g1 = gaussian(dt, 2, 1.3)
g2 = gaussian(dt, 6, 2.2)

#Cross-correlation of two 1-dimensional sequences. This function
# computes the correlation as generally defined in signal
# processing texts: z[k] = sum_n a[n] * conj(v[n+k])
# with a and v sequences being zero-padded where necessary
# and conj being the conjugate
xcorr = signal.correlate(g1, g2)

# The peak of the cross-correlation gives the shift between the
# two signals The xcorr array goes from -nsamples to nsamples
dt2 = np.linspace(-dt[-1], dt[-1], 2 * n_ele - 1)
print 'phase shift: ', dt2[xcorr.argmax()]
Interested readers are encouraged to read more about phase difference calculation @ http://stackoverflow.com/questions/6157791/find-phase-difference-between-two-inharmonic-waves
To accelerate the calculation, people usually transform this problem into Fourier domain to determine the phase correlation between two PDAF sensors, which is also a general technique for translation, rotation, and scale-invariant image registration. For example, given the following two images, with only translational movement between them,
one can compute the phase correlation between the two input images as:
import numpy as np
from scipy import misc
import matplotlib.pyplot as plt
def rgb2gray(rgb):
return np.dot(rgb[...,:3], [0.299, 0.587, 0.144])
im1 = misc.imread('trans_t2.png')
im2 = misc.imread('trans_t1.png')
img1 = rgb2gray(im1).astype(np.float)
img2 = rgb2gray(im2).astype(np.float)
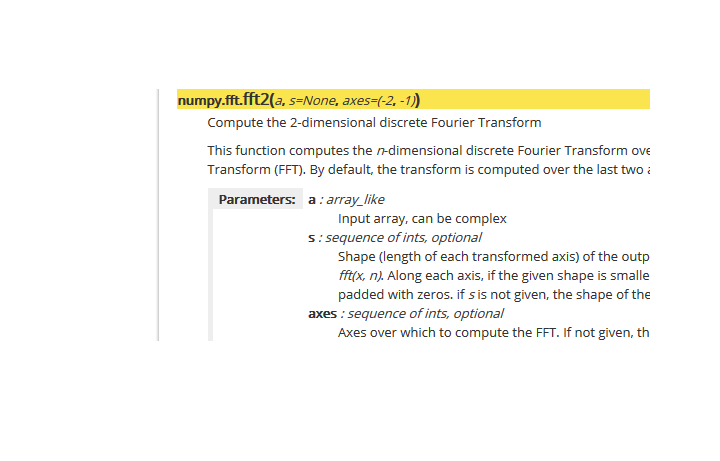
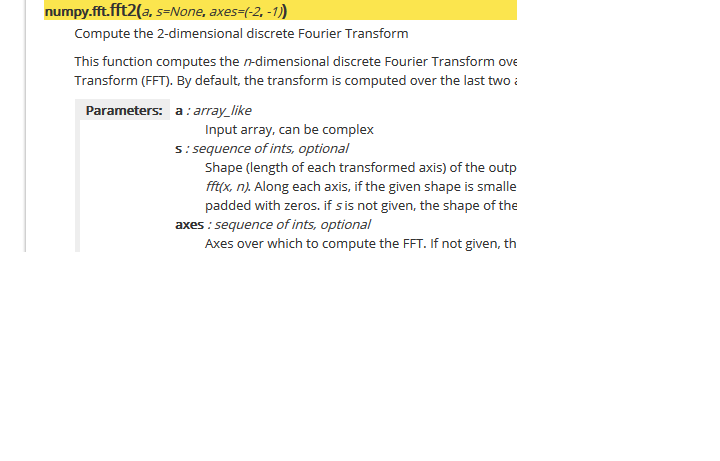
f1 = np.fft.fftshift(np.fft.fft2(img1))
f2 = np.fft.fftshift(np.fft.fft2(img2))
tmp1 = np.multiply(f1, np.conjugate(f2))
tmp2 = np.abs(np.multiply(f1, f2))
tmp3 = np.abs(np.fft.ifft2(tmp1 / tmp2))
translation = np.unravel_index(np.argmax(tmp3), tmp3.shape)
print translation
For more details, please refer to :
Reddy, B. S. and Chatterji, B. N., An FFT-Based Technique for Translation, Rotation, and Scale-Invariant Image Registration, IEEE Transactions on Image Processing, Vol. 5, No. 8, August 1996.
